


BI & Visualization
Get Visual Insights from Your Business Data
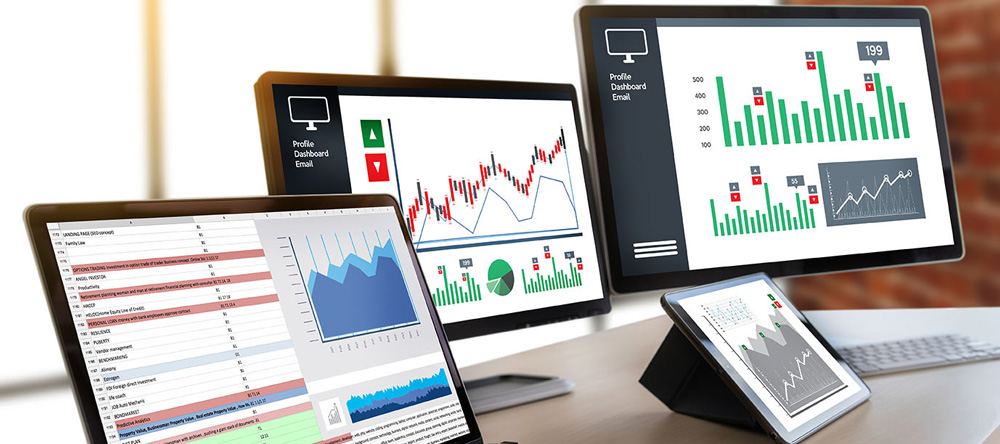
Data Visualization is the most effective way of communicating what data or information at hand is trying to convey, in a graphical format. In simple terms, it is the visual representation of huge volumes of data. Data can be visualized in the form of reports, plots, infographics, and graphs. These can be generated by using different tools available in the market. Visual formats of data are easy to consume and digest, and aids decision-makers in analyzing the data faster. Visual data gives you an insight into past performance, current performance and the trends over a period of time. These data points help in predicting what could work in the future. Well curated data represented graphically in a dashboard makes it easy for the top management to assess the situation at hand and make notable inferences. Hence, many companies are on the lookout for the perfect data visualization tool that can not only give a comprehensive view into their data but also unearth key insights which may not be visible evident. Slice and dice of data is one of the key demands of most organizations wherein they want to look at all facets of the data available at hand. Some aspects of data visualization that we work on

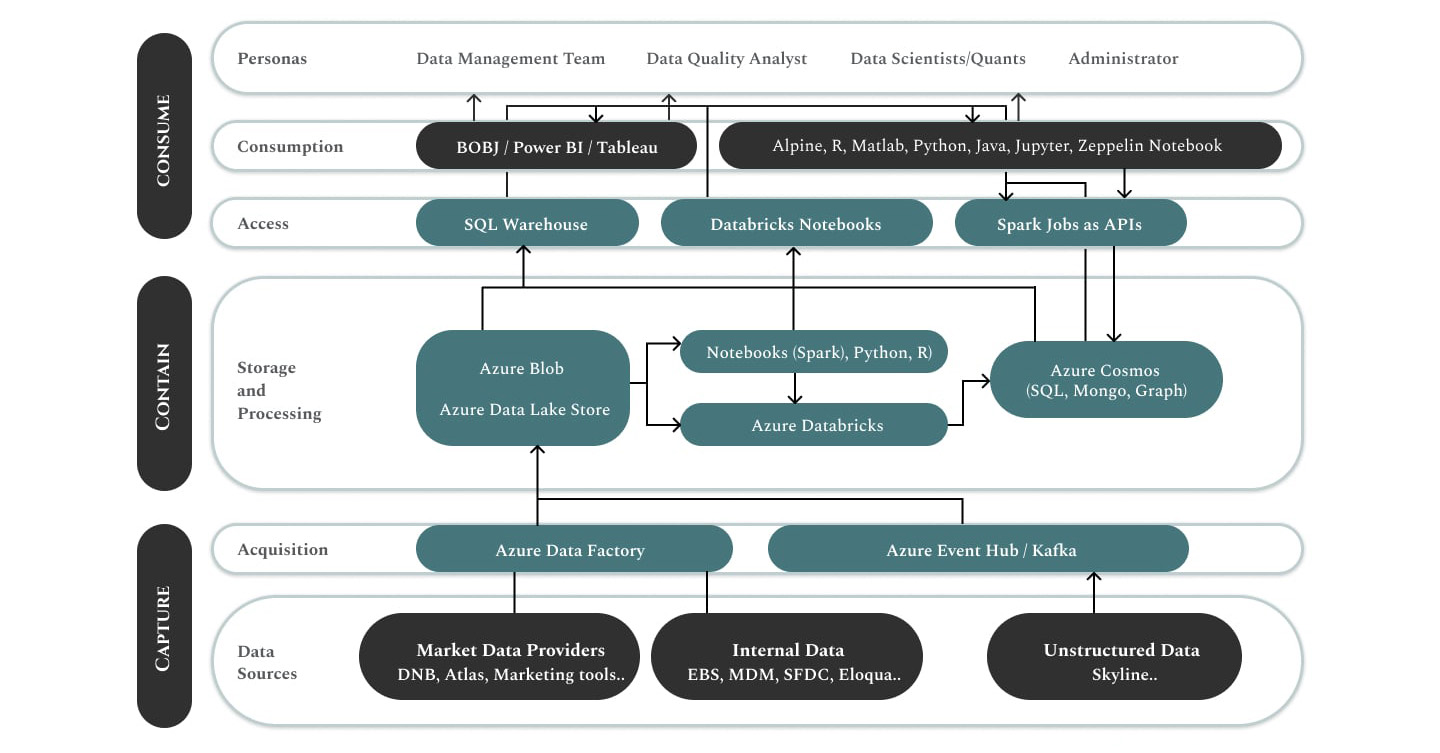
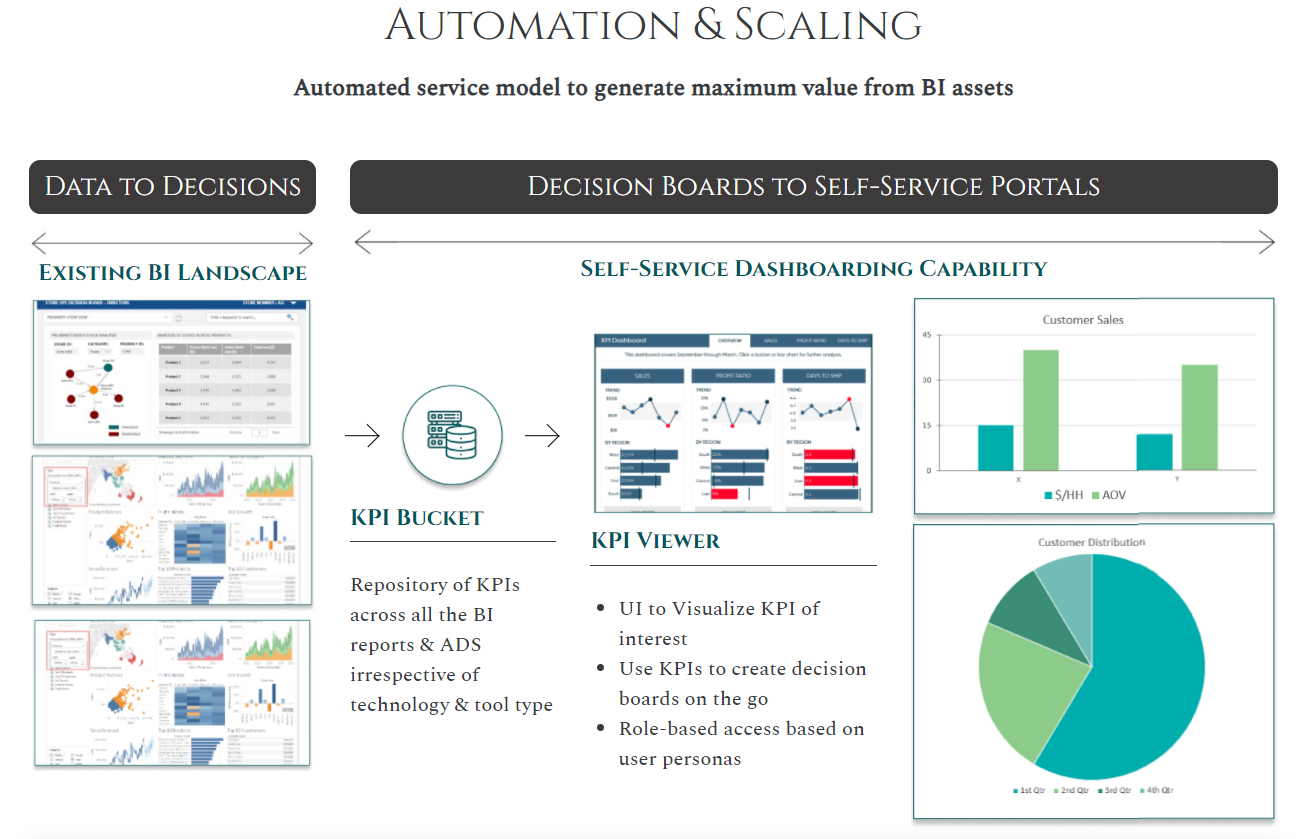
Organizations can quickly prepare, analyze and explore data to notate, highlight and share meaningful insights with key decision-makers to identify the important ‘nuggets’, buried in traditional data. It allows organizations to create ‘Citizen Data Scientists’ and to anchor advanced analytic skills. It can be used to identify data patterns and trends and predict the results better. We help our clients connect several data sources successfully, collate data from all sources efficiently, cleanse all the data properly, and then perform accurate data analysis.

We develop fully informative, comprehensive executive data dashboards which can be accessed by the senior leadership of companies to get a clear understanding of their business data, across business functions and units.
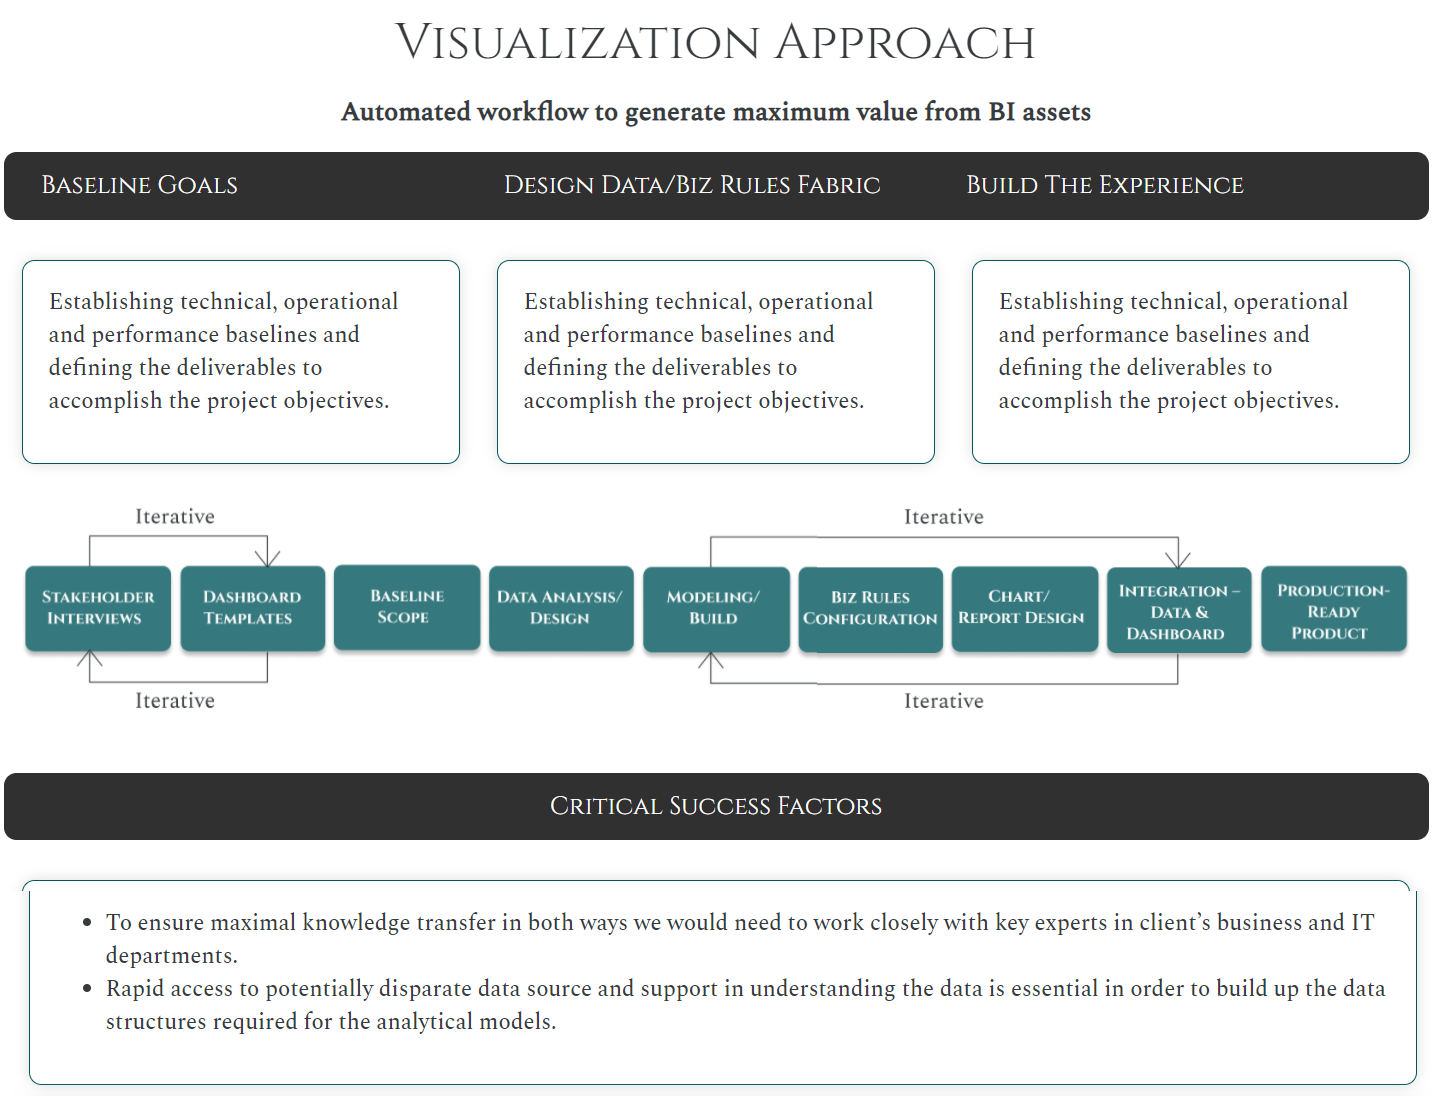
We help with ‘like for like’ or re-engineering our clients’ reporting platform. Our experienced data professionals help create an effective strategy for a successful migration.

We help our clients uncover patterns from huge volumes of data using the statistical and data science lens. There are a number of techniques for data visualization like Circos, Parallel sets, Fineo, etc. some of which we utilize for effective representation of data visually.
;)
;)
 1603, Capitol Ave Suite 310, Cheyenne,
 enquiries@initiatefirst-is.com
 Facebook
 LinkedIn